Wednesday, 15 June 2005

He said, she said journalism

Not having analyzed the data (a big caveat for a social scientist, mind you) I’ll agree with the critics who aren’t buying the evidence from a Heritage report that suggests that “abstinance pledge” programs work. Not that the story makes that much sense, since it’s clear the author doesn’t actually know anything about social scientific research and just relies on an expert and the authors of the original study to rebut the paper.

But Matthew Yglesias’ critique really goes off the rails. First he complains, “the study was not peer-reviewed, is unpublishable in real academic journals, uses an unreliable data source, and only supports the conclusion when you use a non-standard test for statistical significance.”

The first two critiques are bizarre, since (a) it has never been submitted for peer review and (b) we don’t know whether or not it’s publishable, since submission for peer review hasn’t happened yet; the lack of publishability is an opinion expressed by someone in the article, not a factual statement. They don’t use any “non-standard test”; they use a p-value of 0.10 as their cutoff, which isn’t the traditional 0.05 and not quite as convincing as 0.05, but isn’t inherently invalid either, and confidence levels aren’t tests (examples of tests are “t” tests and “Wald” tests; p values are the results of statistical tests).

The only critique that’s even vaguely valid is that the data source is unreliable, as it relies on self-reporting by respondents of their behavior. This is a problem, to the extent you believe that people who have signed abstinence pledges are more likely to lie about their sexual activity than those who haven’t. I’ll concede that it’s possible that that’s the case. Mind you, Heritage didn’t come up with the data—HHS did—and trying to get people to accurately self-report anything is harder than it looks.

Then Yglesias turns and goes completely bizarro:

The only newsworthy information in the story is that the Bush Department of Health and Human Services has decided for some reason to start contracting out research on controversial questions to an ideological think tank that is non-partisan in name only, rather than to proper independent analysts.

There is no evidence in the story that Heritage was working under any sort of HHS contract. On the contrary, Heritage appears to have analyzed data, produced under HHS and CDC contract, which is in the public domain.* They then presented their results at a government-sponsored conference. The next step would be to fix any problems in the paper (and the article suggests there were some), and then submit the paper to a peer-reviewed journal. That’s how social science is done.

Now, mind you, it might be premature for the New York Times to be calling attention to this story, but given public interest in the issue—and the Times’ possible interest in discrediting this evidence, not that I’d suspect the paper of having an ideological bias in its reporting decisions—I’m not sure I can fault them for covering preliminary results that (potentially) rebut a serious critique of administration policy.

* If the CDC had helped fund either analysis, it would be traditional for the studies to acknowledge the funding at the beginning of the paper in a note. I think it’s more likely that the Times meant to say that the CDC helped fund the HHS survey, not the Heritage study.

Monday, 9 May 2005

More lies

Well, the real evaluations—rather than the fake ones here—are in, and they’re much better than those from last semester, by well over a standard deviation. (I’d sit down and do the independent samples t test, but I’m not that bored. t test below the fold…)

I’m just chalking this one up as yet another in a series of little ironies that have been running around for the past couple of months.

Monday, 18 April 2005

Reapportionment math

Steven Jens has posted some dummied-up figures for how the reapportionment of Congress would go if the population trends in 2004 continue through the end of the decade. It’s moderately interesting that both Alabama and Louisiana would lose a representative each; like Mississippi, one presumes they are gaining population, but not quickly enough to keep pace with the national rate.

Also: will someone explain to me why when legislative districts don’t have equal populations people use the term “malapportionment”? Reapportionment refers to the process of allocating House seats to states, while redistricting refers to the process of redrawing district boundaries to compensate for population shifts within states, so why would bad (or nonexistent) redistricting be called malapportionment instead of maldistricting? (If I don’t get an answer here, I may have to interrogate my civil liberties students Wednesday on this topic…)

Saturday, 16 April 2005

Tennessee county growth rates

As requested in comments here, I’ve produced a map of Tennessee county growth rates; here it is in Adobe PDF format. (Once I had the code written for Mississippi it was trivial to produce one for Tennessee.)

I’m still working on a southeastern U.S. map, but it’s made much more complicated because I can’t figure out a way to toss out the Virginia independent cities, which aren’t in the map data in the maps package, from the census data in R. I may just edit the raw data file before reading it in.

Thursday, 14 April 2005

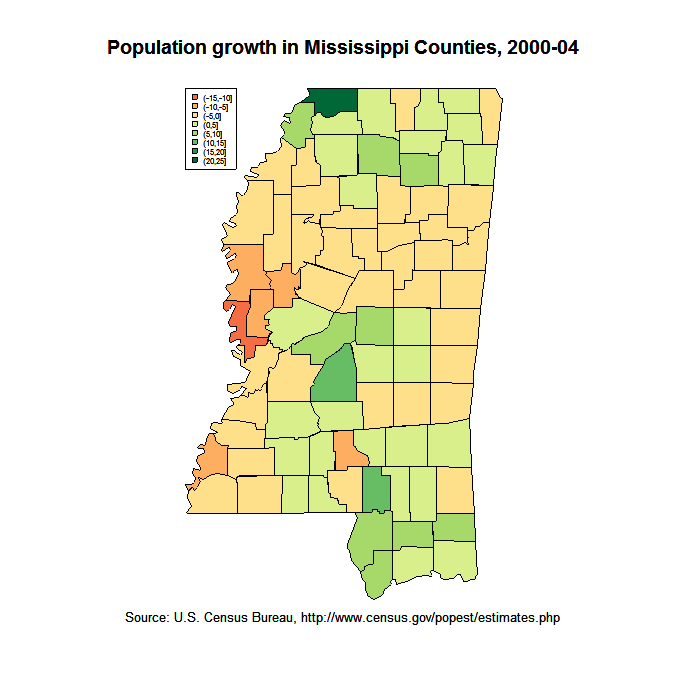
Mississippi county growth rates

As James Joyner notes, the Census Bureau today released statistics on the estimated growth rates of U.S. states and counties; the nitty-gritty is at the Census Bureau website, while the fastest-growing counties are the focus of attention for many in the media. Only one Mississippi county, DeSoto County (bordering Memphis), ranked in the top-100 nationwide in growth.

To flex my R skills, I put together a map of Mississippi counties and their growth rates, reproduced below the fold.

As you might have expected, among the fastest-growing counties were the suburban counties—DeSoto County near Memphis, Rankin County and Madison County near Jackson, and the Gulf Coast counties (Harrison, Hancock, and Jackson). Absolutely stunning is the turnaround in Tunica County, the only Delta county to post a positive growth rate; it’s growing at a 9% clip. Meanwhile, the hollowing-out of the Pine Belt, much of the hill country, and most of the Delta continues apace.

Friday, 4 March 2005

College entrance exams

The Times today also has a piece on the trend of more students taking both the ACT and SAT, due in part to recent changes to the SAT. I found this passage in the article somewhat disturbing, however:

“There’s almost no reason not to take ACT,” said Lisa Jacobson, chief executive of Inspirica, a tutoring and test preparation company in New York. “The only significant reason not to is if a kid is totally stressed out, and doesn’t want to spend another Saturday taking tests.”

Students have nothing to lose by taking the ACT, she and others say, because they can take the test as many times as they want and choose which scores, if any, to send to colleges—a calming option for students with severe test anxieties. In contrast, all SAT scores are sent to all colleges a student applies to. [emphasis mine]

Doesn’t this fact shoot any meaningful comparability between the two tests straight to hell, despite the well-known “equivalency tables” between the two exams?

Thursday, 17 February 2005

Correlation is not causation (volume 32 in a series)

Todd Zywicki suggests that increased advertising for legal services has increased bankruptcy filings. I tend to think that to indicate causation, Zywicki ought to at least demonstrate whether the trend in bankruptcy filings was flat before the Supreme Court found lawyers’ commercial speech constitutionally protected in Bates v. State Bar of Arizona. Unfortunately (for him, at least), Zywicki’s graph starts in 1979, two years after the 1977 ruling in Bates.

Even if he could show that, considering that this time period also corresponds with the emergence of the consumer credit card industry it would be difficult to disentangle the two effects. Slithery D is also unimpressed.

This is my entry in today’s OTB Traffic Jam.

Tuesday, 25 January 2005

Grade stagflation

Since before Robert’s post on this topic, I’ve been pondering grades in general, prompted by this post by Will Baude relating his experience at Yale, where he hasn’t yet “taken any classes that attempt to draw actual distinctions among the students.” Indeed, the very purpose of grading (as opposed to marking, as my Canadian colleague refers to it) is to discriminate among students on the basis of their academic performance. Thus all of the participants in the debate are right in their own ways, but I think they (individually, at least) miss the big picture.

Leopold Stotch and Steven Taylor both bemoan the administrative meddling in grade assignment inherent in Princeton’s decision, a sentiment with which (as a fellow political science professor) I must concur, lest we become like those emasculated law profs who not only no longer control their grades but also lack control over their own exam conditions. On the other hand, Nathan Novak thinks it’s a non-issue, due to the widespread use of class rank to compare students from different institutions; Andrew Samwick makes a similar point, although he acknowledges that grade inflation does lead to compression of the grade range. At the extreme end of the scale, the Grouch thinks grades don’t matter at all; I wouldn’t go that far, due to reasons of path dependence, but I can see his point—few people today care what grades I got in high school or as an undergraduate, but I wouldn’t be a professor today if I hadn’t gotten mostly A’s and B’s.

I think what Princeton is trying to do (rightly or wrongly) is address the “compression” problem that Andrew talks about—if 50% of the class are getting A’s, ny meaningful discrimination among those students has been eliminated; in other words, there’s been a loss of information in the process. If the purpose of grading is simply to drop passing students in buckets based on their absolute performance, giving 50% of students A’s might be appropriate; on the other hand, if the purpose of grading is to determine the relative merit of students, putting 50% of them in a single category isn’t very helpful.

The trouble is, we expect grades to do both of these things. The Millsaps college catalog, for example, requires all political science majors and minors to earn C’s in all of their coursework for the major (which leads to its own sort of compression effect, since effectively the minimum passing grade is raised from a 60 to a 73), and students must maintain a 2.0 GPA to participate in various and sundry extracurricular activities—the C and 2.0 represent absolute standards. But we also use grades to evaluate relative achievement, for election to honorary societies such as Phi Beta Kappa and for awarding other honors.

I don’t know that there’s a simple answer to these problems, although perhaps including measures of central tendency and dispersion along with assigned grades (as is at least partially the case at Dartmouth, according to Andrew) might be a good start.

Thursday, 20 January 2005

Poll'd again

Me, November 3rd:

My gut feeling is that the [2004 national exit polls] in part failed because the networks replaced VNS; Edison/Mitofsky was new at this, and a rookie effort is fraught with perils—as I learned myself yesterday. Coupled, perhaps, with a small cognitive bias on the part of the people being paid by Edison/Mitofsky to conduct the poll themselves (one suspects the typical person looking for day-work isn’t a Republican) and you can easily see why they were quite a bit off, notwithstanding the advertised margin of error.

Edison/Mitofsky, Wednesday:

[B]ased upon the Within Precinct Error that was observed in the 2004 general election we plan to make some enhancements to the exit poll interviewer recruiting process.

  • We will use recruiting methods that reduce the number of students and young adults we use as interviewers.
  • In addition to the standardized rehearsal and training dialog, we will add a standardized pre-rehearsal training script for all individual phone training conversations.
  • We will evaluate other training techniques such as a video training guide and interviewer tests and use the Internet more effectively as an interviewer training tool. (64)

There’s a lot more there if you really care about exit polling techniques, but the bottom line is that interviewer problems seem to account for much of the pro-Kerry bias in the Edison/Mitofsky poll. (þ: Wizbang)

Saturday, 15 January 2005

Roid rage

David Pinto has a good explanation of Type I and Type II error in the context of baseball’s new plan for steroid testing, while Jayson Stark has a pretty good Q and A on the agreement that nonetheless makes a rather dumb statement:

What’s amazing, in some ways, is that one positive steroid test actually carries a more serious penalty than a cocaine-possession conviction. One positive steroid test leads to an immediate suspension. It takes two cocaine convictions to get suspended.

Unless someone shows some evidence that doing coke or pot improves athletic performance, it seems to me that baseball is properly putting the emphasis on drugs that affect the integrity of the game; while it’s potentially embarrassing to the league to have a coke-head on the field, his presence doesn’t encourage any other player to do coke. Indeed, if coke and pot were legal substances, it’s likely the only ban on those substances in any sport would be on their use on the field because of public image issues, similar to the ban on tobacco use.

Wednesday, 22 December 2004

Gay marriage and Democrats

The GayPatriot thinks that pro-gay-rights advocates have “red state” demographics working against them (þ: InstaPundit). They may also have some problems in their base—in states “blue” and “red” alike. Here’s some numbers among self-identified Democrats from the exit poll we did in Jackson (estimated margin of error ±3.6%, α=0.05):

Race Supports same-sex marriage ban Opposes same-sex marriage ban
Black 79.5% 20.5%
White 39.9% 60.1%

Now, I would expect Jackson voters (black or white) to be more socially conservative than those in the nation at large, but I don’t think that 40-point margin between black and white Democrats would be that much smaller in, say, Oakland or Boston.

Of course, turning this into a working cross-cutting cleavage for Republicans is going to be hard work as long as the GOP can’t keep its semi-regular bigot eruptions under control.

Wednesday, 24 November 2004

Exit poll prelims

I’m now most of the way through (with some help from a few students) entering the data from our exit poll three weeks ago. Based on 632 respondents, there are a few things that jump out at me:

  • Never ask people if they consider themselves born-again Christians, because apparently they don’t understand that question. Ditto asking them to figure out if they are “Protestant.”
  • People who don’t have friends or family members who are gay were 2.5 times (!) more likely to vote for the same-sex marriage ban than those who do have gay friends or family members. This suggests that a compelling political strategy for gay people who support same-sex marriage is to come out.
  • Younger people were significantly less likely to support the amendment than other people. This suggests that (combined with the strategy above) all people who support same-sex marriage should wait for a lot of old people to die off.
  • Black voters are much more likely than white voters to believe Clarence Thomas is the chief justice of the United States.

There’s other fun stuff in the poll that I’ll get to once our last precinct is entered and the data is properly cleaned up.

By the way, if you need to enter a lot of data, I cannot say enough good things about EpiData. It’s very slick and the price is right.

Friday, 19 November 2004

More Diebold scaremongering

Kieran at Crooked Timber is the latest to point to a UC-Berkeley study that represents the new Great Kerry-Really-Won Hope for the left; there’s apparent county-level evidence that Florida counties that used electronic voting had a greater increase in Bush support from 2000 than counties that used optical-mark scanning. Rick Hasen has dug up some skeptical responses from voting experts, while Patrick Ruffini notes the bivariate relationship counters the authors’ thesis.

Of course, Diebold and the other e-voting manufacturers could have forestalled all of this silliness from the start by including a paper trail in their equipment.

Update: Andrew Gelman says only two counties are driving the results: the adjacent Southeast Florida counties of Palm Beach and Broward, both of which have relatively large Jewish populations (and thus might have been disproportionately more likely to vote Democratic in 2000 for the Gore-Lieberman ticket than for the 2004 Kerry-Edwards ticket).

Friday, 5 November 2004

Why statistics are helpful

Philip Klinkner manages to present in a four-line table what takes Andrew Sullivan’s anonymized correspondent a paragraph and a bunch of raw numbers.

Both, incidentally, show that the anti-same-sex marriage initiatives had no effect on Bush’s share of the vote in the states where they were on the ballot.

Exit polls misjudged?

Contrary to popular wisdom, Andrea Moro says the final exit polls were accurate and has the numbers to prove it. However, that doesn’t quite explain how the networks nearly blew the calls based on the Kerry-leaning numbers they had—and, once you have the final results, it’s easy enough to go back and reweigh the data to match the “true” results; I’d be curious if anyone has hardcopy of the exit poll results, including the weights, dating from before the returns came in.

Thursday, 14 October 2004

The Other Side

Maria Farrell isn’t too happy with her introductory statistics course. There are a couple of points in the comments to her post that I think are key:

  • “Statistics is a practice, not a toolkit.”—Bill Tozier.
  • “I wonder if the obscurity is partly a result of a lack of the why of statistics.”—Randolph Fritz.

I was in my chair’s office today talking about how my methods class was going, and the second point was one we both hit upon.

Next year, I’d like to move more in the direction of applied data analysis. This year I’ve been doing baby steps in that direction—every student has a CD with R Commander, and I show how to use R Commander to do every statistical procedure we go over by hand… for the moment, I’ve been using the Chile data set included in the car package as my “guinea pig” data.

I also think that students do better when the professor is engaged and enthusiastic about the material; this, of course, applies to any class from intro on up, but I think it’s particularly important when the class is one that students approach with some degree of resistance.

Thursday, 26 August 2004

Explanation, prediction, and the Fair model

There’s been some discussion of late of Ray Fair’s model, and particularly its prediction that George Bush will walk away with 57.5% of the two-party vote in November. Bill Hobbs and Don Sensing find this to be interesting—and, at some level, I suppose it is. But I have to mention a couple of caveats:

  1. I seriously doubt either major-party candidate will get 57.5% of the two-party vote. A few numbers for comparison: Ronald Reagan’s landslide in 1984 against Walter Mondale netted 59.2% of the two-party vote, while Bill Clinton’s pounding of Bob Dole got 54.7% of the two-party vote. I’d frankly be surprised if Fair’s forecast is even correct within his stated margin of error (±2.4%). To be gracious to Fair on this point, he does candidly acknowledge that there could be specification issues that would inflate the forecast.
  2. I think forecasting models do a poor job of explaining the causal mechanisms that take place. The national economy doesn’t vote—rather, about a hundred million Americans do, and the effects of the national economy on individuals are for the most part weak (but, admittedly, can be quite strong for voters in particular industries and regions).

Of course, a third caveat is that forecasting the national vote-share is (in my opinion) a misspecification of the institutional conditions under which the election takes place; there are 51 elections (in the 50 states and District of Columbia) that allocate representation in the electoral college, and I generally think that understanding those 51 elections is much more important than forecasting the headline figure, which only has a tenuous relationship with the substantively meaningful outcome (who wins the election).

Also (potentially) of interest: back in my slightly-more-prolific days, I posted a brief exposition of my distaste for (and disinterest in) election forecasting models.

Wednesday, 4 August 2004

Once more into the breach

Stephen Bainbridge (via Glenn Reynolds) isn’t impressed with the use of NOMINATE scores to cast John Kerry as more of a centrist; nor is he particularly thrilled with methods like NOMINATE to begin with:

Personally, I find the interest group scores much more accessible and transparent. For one thing, NOMINATE counts all nonunanimous roll calls, which can include a lot of procedural and uncontroversial (even nonpartisan) bills. The interest group rankings focus on bills that really tell us something about the political philosophy of the candidate in question. For another, the interest group ratings are widely used both by the media and, perhaps more important, by politicians themselves.

I’d respond that NOMINATE (and related methods) are preferable to interest group scores precisely because they count all nonunanimous roll calls; this avoids the selection effect where interest groups choose, say, twenty “key” votes as a litmus test for an entire session. And, presumably, those who vote on party lines on “nonpartisan” and “uncontroversial” bills are even more partisan than those who join with their natural opposition. Another worthy point in favor of NOMINATE: the “procedural” versus “substantive” distinction is largely subjective; cloture votes in the Senate, for example, are technically procedural motions to end debate (and potentially stop a filibuster), while procedural votes on rules in the House often have serious substantive consequences (by ruling certain amendments out-of-order, framing and controlling debate, and sometimes even amending the legislation in question).

Now, Clinton, Jackman, and Rivers are quite correct to point out that the statistical properties of NOMINATE are, at best, nebulous, although Lewis and Poole recently made a worthy effort to gain additional leverage on the bias and uncertainty of NOMINATE in Political Analysis. And, while some of the differences in the results of the techniques are the result of differences between the distributional assumptions of NOMINATE and the CJR scaling method* (which explains the differing positions of Kerry in years in which he missed a lot of roll calls), there are some good reasons to prefer the CJR technique—most notably, it’s significantly more tractable; you can estimate the model almost trivially using MCMCpack.

Anyway, for those with a morbid curiosity about these techniques, the latest American Political Science Review has an article by Clinton, Jackman, and Rivers called “The Statistical Analysis of Roll-Call Data,” which I recommend highly (and which you may or may not be able to access via this link).

I’ve posted previously on NOMINATE and related methods (again, in relation to John Kerry’s voting record) here and here. This is my entry in today’s Beltway Traffic Jam.

Tuesday, 3 August 2004

Discovering S

Michael Jennings has been taking a crash course in R and S-PLUS programming. I’d still have to say my R is quite weak, for largely the same reasons my Perl is pretty weak—there’s too much overlap with C, which leads to bad coding style.

Probably the moral of the story is either that I need to start working with RPy, or need to figure out how to convince colleagues that becoming more proficient in R (and contributing to it) is hireable/tenurable activity.

Sunday, 1 August 2004

USA Today 1, AAPOR 0

Glenn Reynolds links a USA Today report on its post-convention poll:

Last week’s Democratic convention boosted voters’ impressions of John Kerry but failed to give him the expected bump in the head-to-head race against President Bush, a USA TODAY/CNN/Gallup Poll finds.

In the survey, taken Friday and Saturday, Bush led Kerry 50%-46% among likely voters. Independent candidate Ralph Nader was at 2%.

The survey showed Kerry losing 1 percentage point and Bush gaining 4 percentage points from a poll taken the week before the Boston convention.

The change in support was within the poll’s margin of error of ±4 percentage points in the sample of 763 likely voters. But it was nonetheless surprising, the first time since the chaotic Democratic convention in 1972 that a candidate hasn’t gained ground during his convention.

In fairness, the report’s headline (“Poll: No boost for Kerry after convention”) is appropriate, and I’m generally all for the reporting of null results when they are substantively interesting. But I wonder how many readers will really appreciate the meaninglessness of the change in support, given that the disclaimer is after the discussion of the marginals, which show a statistical dead heat and zero meaningful change since the previous poll.

Tuesday, 13 July 2004

Correlation, causation, and other fun stuff

Eugene Volokh finds a shocking relationship between ice cream consumption and sex crimes. Fun with stats ensues.

(This item is blogged so I remember to shamelessly rip it off when I teach methods in the fall.)

Tuesday, 22 June 2004

SN scoops Drudge on bias study

Steve Verdon and I managed to scoop Matt Drudge on this working paper by Tim Groseclose and Jeff Milyo that attempts to quantify the bias of media outlets using the ADA scale. Where’s my gold star?

Meanwhile, James Joyner reacts to the paper itself. I agree that the method of using think-tank citations isn’t ideal, but I can’t come up with a better one offhand that allows you to put members of Congress and media outlets in the same measurement scale without a lot of a priori assumptions. (There are some other critiques at the Dead Parrot Society.)

Update: As Brock points out, Alex Tabarrok scooped us all. Story of my life.

Friday, 18 June 2004

Evidence of media bias

Steve Verdon links a working paper (an updated version of which will be presented at APSA in September) by political scientists Tim Groseclose and Jeff Milyo that attempts to quantify the partisan leanings of various media outlets on the basis of their reliance on think tanks for “neutral” information in straight-news stories. Estimated ADA scores for the think tanks are derived from their citations by politicians in the Congressional Record, which are then used to estimate ADA scores for the New York Times, the Los Angeles Times, USA Today, the Drudge Report, Fox News’ Special Report, and the three broadcast network evening newscasts.

I’ve only skimmed the paper so far, but this seems like a fairly sound approach to the problem. As for the results… well, unless your name is Eric Alterman, I doubt you’ll be very surprised.

Wednesday, 9 June 2004

Someone needs to read someone's dissertation

Will Baude:

Voting instrumentally (in presidential elections, at least) is quite irrational, except to the extent that voters enjoy doing it. The probability of any single voter changing the outcome of a presidential election is 0.

Tell that to a voter in Florida in 2000 (his probability was about .002, which isn’t great, but beats the heck out of the lottery). Because of the electoral college, the probability of any single voter changing the outcome of a presidential election varies from state to state, and is a function of the competitiveness of the election in that state. But you don’t have to believe me; instead, believe, er, Chris Lawrence:

For [supporters of third party candidates], the strategic/sincere choice rests on whether their vote is likely to be pivotal. Although Downs (1957) argues that casting a non-strategic vote is irrational, that is only the case if the vote has a non-negligible chance of affecting the outcome of the election. Sincere voting for minor candidates is irrational in the sense that elections are not normally thought of as a forum for expressing general preferences, but rather as a “selection process”; however, if political actors respond to election results as if they are referenda on particular policies espoused by candidates, sincere voting for minor candidates may be rational in certain circumstances. If a citizen’s vote is almost certainly not pivotal, it may be rational for voters to show their public policy preferences by supporting a minor candidate. ...

Thus, voters may be considered rational if they express a preference, rather than merely taking part in a “selection process,” in states where their vote is highly unlikely to make a difference in the outcome. For example, according to CNN (2000), only 20 of the 51 elections for electors in 2000 were in so-called “battleground” states that were expected to be close. Thus, a voter in one of the other 30 states or the District of Columbia could presumably vote for a third-party candidate and thus have virtually no expectation of affecting the presidential contest, as their vote would be highly unlikely to affect the disposition of their state’s electors. (103–04)

Unfortunately, the astounding finding that the variation in “pivotalness” of an individual’s vote varied in 2000 by a factor of nearly 1000 between the most competitive and least competitive state didn’t make it into then-Mr. Lawrence’s dissertation, although it has made it into at least one presentation of the findings of this chapter.

Sunday, 6 June 2004

Damnedest of them all

Professor Bainbridge roots for the Redskins to win one for a very idiosyncratic reason:

A 72-year streak links the victory or defeat of the Washington Redskins on the eve of election day with the presidential race. If the Redskins go down to defeat or tie, the sitting president’s party loses the White House. That leaves the fate of President Bush squarely on the shoulders of Redskins head coach Joe Gibbs. Hometown hero Gibbs, who led the team to three Super Bowl titles, retired after the 1992 season and now has returned to the team’s helm.

The Redskins face off against the Green Bay Packers at FedEx Field on Oct. 31 — the last game before the election Nov. 2. ...

The Redskins’ performance has aligned with the presidential outcome in the last 18 elections — a probability of 1 in 263.5 million, according to Dave Dolan, an assistant professor of statistics at the University of Wisconsin-Green Bay.

Bainbridge at least acknowledges that this result “is a spurious correlation generated by data mining.” No such luck for someone else who should know better (quoted by Steven Jens):

From UVa poli-sci prof Larry Sabato comes word that no incumbent president with a four-letter last name has ever won (I’m avoiding using the term “re-elect” so as not to exclude Ford).

Sabato deserves his own personal category here at Signifying Nothingparticularly considering that I’m stuck with using his god-awful American government text in the fall. Even “Burns, Peltason, and 17 other dead people” would be better.