As James Joyner notes, the Census Bureau today released statistics on the estimated growth rates of U.S. states and counties; the nitty-gritty is at the Census Bureau website, while the fastest-growing counties are the focus of attention for many in the media. Only one Mississippi county, DeSoto County (bordering Memphis), ranked in the top-100 nationwide in growth.
To flex my R skills, I put together a map of Mississippi counties and their growth rates, reproduced below the fold.
As you might have expected, among the fastest-growing counties were the suburban counties—DeSoto County near Memphis, Rankin County and Madison County near Jackson, and the Gulf Coast counties (Harrison, Hancock, and Jackson). Absolutely stunning is the turnaround in Tunica County, the only Delta county to post a positive growth rate; it’s growing at a 9% clip. Meanwhile, the hollowing-out of the Pine Belt, much of the hill country, and most of the Delta continues apace.
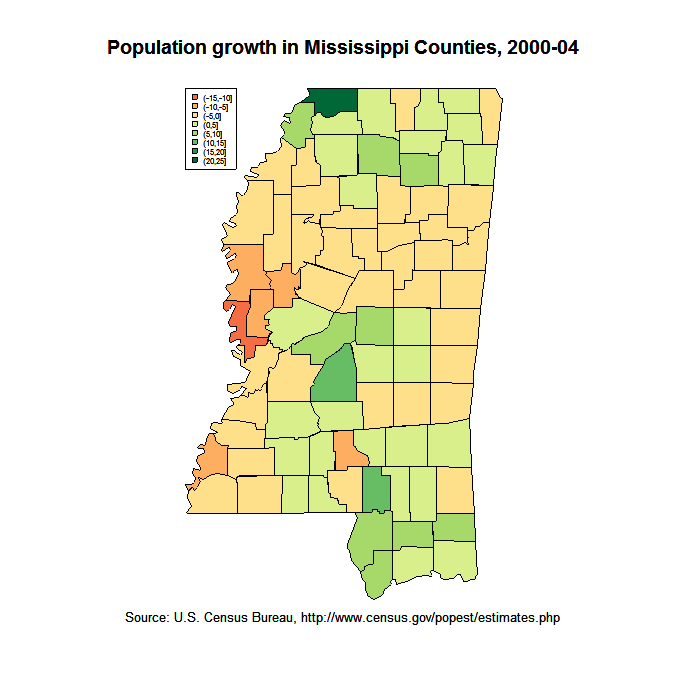
(Apologies for the lack of projection; I couldn't figure out how to make the mapproj package do a Transverse Mercator projection.)
As requested in comments here, I’ve produced a map of Tennessee county growth rates; here it is in Adobe PDF format. (Once I had the code written for Mississippi it was trivial to produce one for Tennessee.)
I’m still working on a southeastern U.S. map, but it’s made much more complicated because I can’t figure out a way to toss out the Virginia independent cities, which aren’t in the map data in the maps package, from the census data in R. I may just edit the raw data file before reading it in.
A sneak preview of part of my Midwest paper, for all zero of you waiting for it at the edge of your seat:
Suffice it to say I’ve spent more of this morning trying to figure out how to get R’s maptools package to merge the raw data with the cartography than I did on the actual data analysis, which was actually quite easy, even though the MCMC took forever.
Choropleth map. Amazing that I got through 32 years of my life without knowing what to call a geographic map that you use to illustrate quantitative data (like this one from the Midwest paper or this one from a few years ago). And, since nobody outside cartography knows what “choropleth” means, I’ll probably never use the term again either.
![[Signifying Nothing]](/local/memlogo-1.png "Welcome to Signifying Nothing")

