![[Signifying Nothing]](/local/memlogo-1.png "Welcome to Signifying Nothing")
A sneak preview of part of my Midwest paper, for all zero of you waiting for it at the edge of your seat:
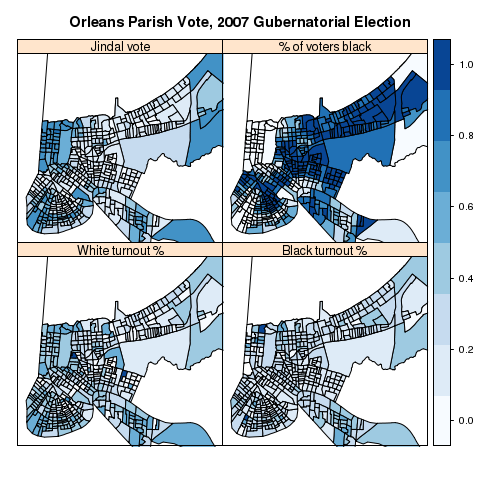
Suffice it to say I’ve spent more of this morning trying to figure out how to get R’s maptools package to merge the raw data with the cartography than I did on the actual data analysis, which was actually quite easy, even though the MCMC took forever.

